
Diagnostic guide
How to diagnose a slow Mac
Start with a task you can repeat, such as opening a project or exporting a video. Watch CPU activity and memory pressure while the delay is happening. If a copy or installation fails, check the available space on the destination drive first.
Published by TheWebFab.
What does memory pressure mean on your Mac?
In Activity Monitor, open Memory and look at the Memory Pressure graph while the Mac is slow. Select its colour and what the Mac is doing when you see it.
Memory is being used efficiently. While the task is slow, also check which processes are at the top of the CPU tab.
Memory pressure is normal after the task. To investigate the delay, repeat the reading while the slowdown is happening.
There is less memory headroom. Watch whether the graph stays yellow and which app is using the most memory during the task.
If the graph stays yellow after the task, sort apps by memory use. Save your work, quit an unused app and compare the graph.
The Mac needs more memory for the current workload. Save your work and run fewer tasks at the same time. Watch whether the graph returns to yellow or green.
Persistent red pressure needs investigation. Identify the largest memory user and quit the corresponding app normally if it is safe to do so. Take the same reading again.
Look for sustained CPU load
Open Activity Monitor using Spotlight, select CPU and sort the processes by % CPU. During the export, see which process stays near the top. Once the export finishes, check whether CPU usage drops and your other app responds again.
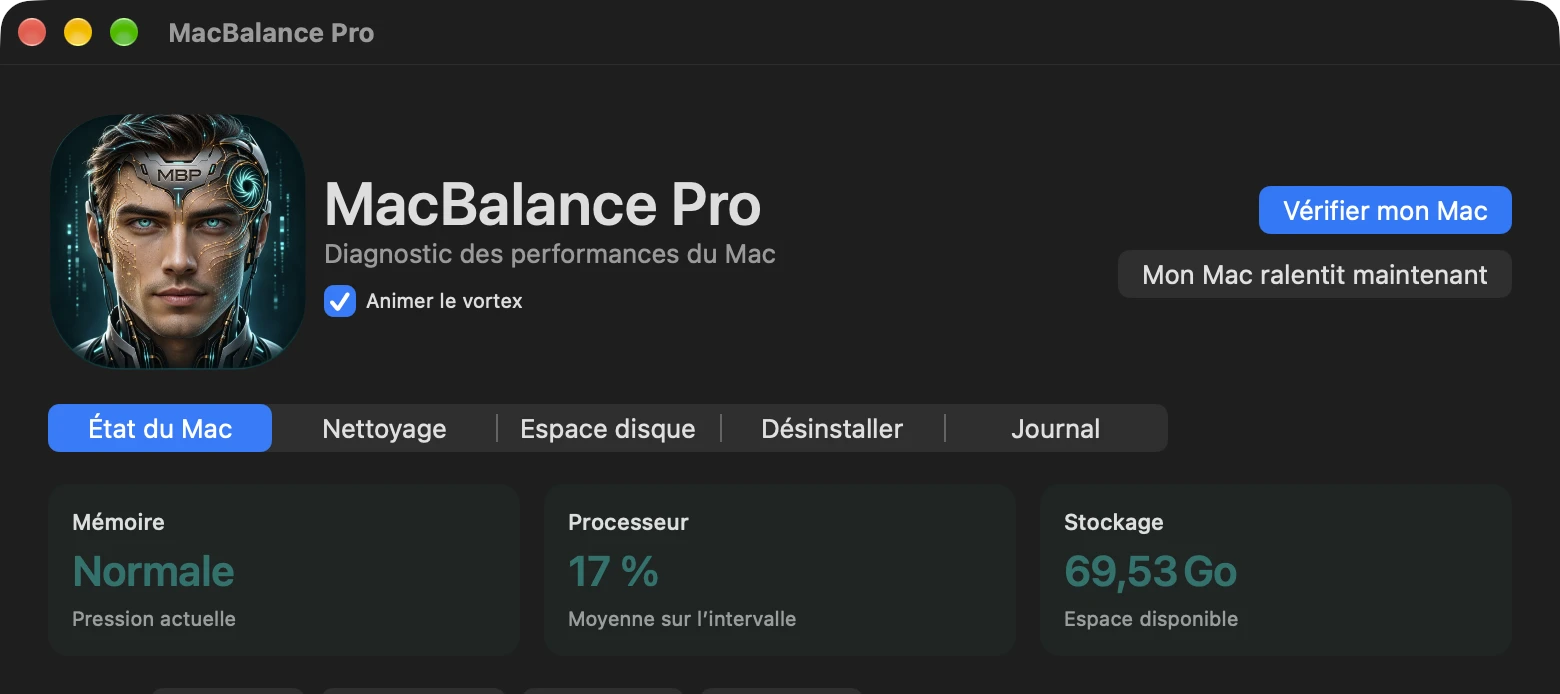
In MacBalance Pro, choose “Mon Mac ralentit maintenant” to start a 30-second observation. The report counts intervals in which total CPU load reached 85%. In the app list, 100% represents one core. That list covers each app’s main process.
Check memory pressure
In Activity Monitor, open Memory and watch the Memory Pressure graph during the slow task. If the graph stays yellow or red, save your work, quit a memory-intensive app you no longer need, then repeat the task. See whether pressure drops and the wait gets shorter.
A large amount of memory in use can coexist with normal memory pressure. MacBalance Pro counts how many readings showed high or critical pressure during the observation.
Inspect storage when space is running low
Open System Settings › General › Storage to see how much space is available on your startup disk. If a download or copy runs out of space, check the file size and which drive you are writing to.
In MacBalance Pro, open “Espace disque” to measure a folder you choose. Under “Nettoyage”, review candidates such as old installers and select the items to move to the Trash. Check the contents before emptying the Trash to reclaim space.
Repeat the task and decide when to stop
Change one thing between attempts and time the same task on the same file. If the usual response time returns and the readings settle, you can stop. If the delay returns while CPU load and memory pressure are normal, record the app, the file and the exact step that stalls so you can narrow the investigation.
For an intermittent slowdown, the MacBalance Pro log shows the daily count of readings under memory pressure across the last 14 observed days. It samples once a minute while the Mac is awake and the app is running.